At-home STEM Activities: Tides and Moon Phases
Dreaming of summer trips to the beach? This week we’re exploring different aspects of aquatic systems.
When going to the beach for the day, there are a few things you need to plan—packing your towel and sunscreen, choosing what to bring for lunch, and checking the tides, so when you get to the shore, your favorite spot on the sand isn’t covered by water.
Ocean tides are one of the most predictable natural phenomena. One cycle of tides occurs about every 25 hours, and the main cause of the rise and fall of the waves is the gravitational pull of the Moon. Even though the Moon is so small compared to Earth—the Moon has about 1/100th of Earth’s mass—it still has enough gravity to affect the Earth’s surface and move things around.
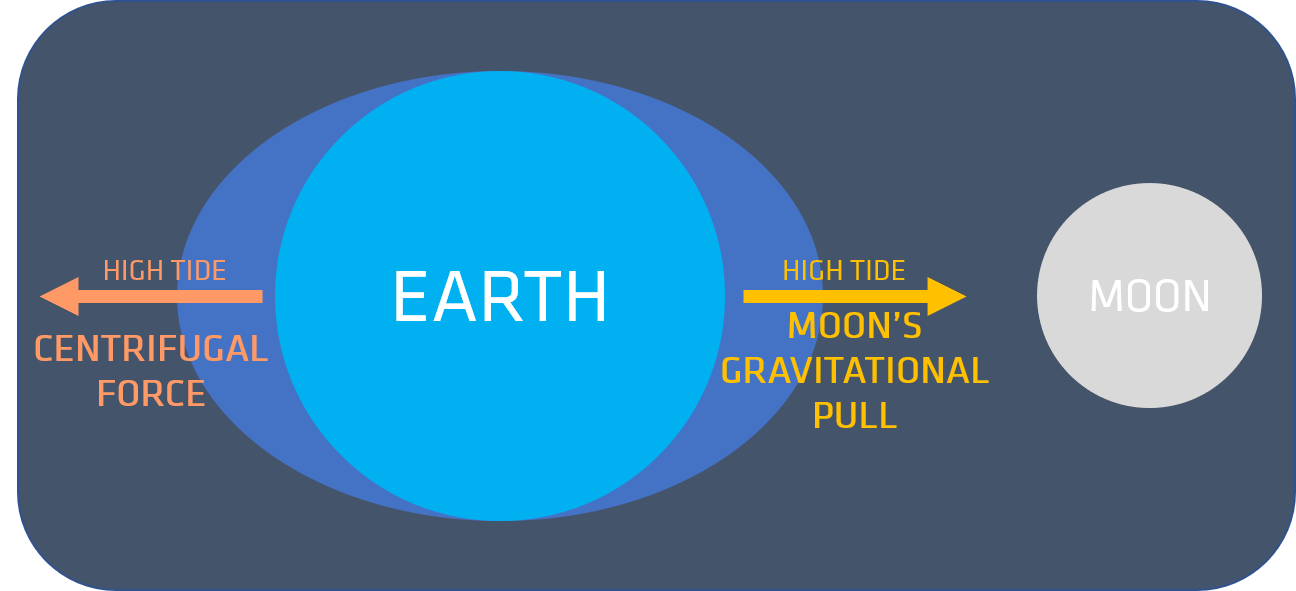
As the Earth rotates, the Moon pulls on different parts of the planet. Both land and water are pulled on by the Moon’s gravity, but since water is easier to move than land, this effect is more noticeable on the ocean. The water bulges out towards the Moon, causing high tides, as shown in the below animation.
The tidal force viewed from the North Pole; Animation via NOAA
So when your part of the world passes through the area closest to the Moon, you’ll experience high tide, and as you move out of that area, you’ll experience low tide. But most areas, experience a second high tide in one day—which is shown in the above animation on the side of the Earth that is not facing the Moon. So if the Moon is pulling the oceans towards it, why do we also experience high tide when we’re facing away from the Moon?
The answer has to do with the rotation of the Earth. When a body travels in a curved path, there’s an apparent force acting on it called centrifugal force. This is what you feel when you’re spinning quickly on a playground merry-go-round—you feel like you’re being pushed off the merry-go-round.
But while centrifugal force feels real, it’s not actually a force acting on a spinning body. Instead, it’s a result of the inertia (the tendency of an object to stay in its state of motion/rest) of the spinning object and centripetal force. Centripetal force pulls the mass inward to stay on the curved path, while the mass’ inertia wants it to go in a straight path. This causes it to appear that the object is being pulled outward.
So back to tides. Since the Earth is rotating, the mass traveling in a curved path is the water in the ocean. When the water is facing the Moon, the Moon’s gravitational pull is stronger than the centrifugal force, so it bulges out for one high tide. When the water is on the other side of the Earth, the centrifugal force is stronger than the Moon’s gravitational pull, so it bulges out for a second high tide.
But there’s more to think about here! In all our diagrams, we’re thinking about the Moon as a stationary object. That’s not the case, though. The Moon rotates around the Earth, which causes different phases of the Moon.
In this diagram, the inner circle around the earth shows how the sunlight is hitting the moon, while the outer circle shows the phases that we see on Earth.
Since the Moon is the main reason we have tides, this leads us to the question: Is there a relationship between the phases of the Moon and Earth’s tides?
Tides and Moon Phases Investigation
Materials:
Calculator
Graph paper
Pencil
Colored pencils
Ruler
Instructions:
Below, we have a list of the National Oceanic and Atmospheric Administration’s high and low tide data for Jaffrey Point in New Castle, New Hampshire from April 2020. To investigate the relationship between the Moon phases and the tides, we want to start by finding the average height for high tide and low tide each day.
To find the average height, add up the two tides and divide by two. If there’s only one high or low tide for a day, that will be the average height. You can check your calculations with the answers below.
You’ll see that some tides have a negative height. The height is measured based on a standard “low water level.” If the height of the tide falls below that measurement, it has a negative height.
Next, with the average heights you found in step 1, create two line graphs—one for the average high tides and one for the average low tides. On your graph, make the horizontal axis the days of April and the vertical axis the height. If you haven’t made a line graph before, check out Math is Fun for a quick explanation. You can compare your graphs to our with the button below.
Now we’ll look for a relationship between the heights of the tides and the Moon phases. Pick a color to represent each phase of the Moon.
Using the below lunar calendar for April, shade in each day of the month of your graphs with your chosen color for each phase.
Calendar via Moongiant.com
So now let’s analyze what we’re looking at. What do you notice about the shape of the line graph representing the average heights of the tides? Do you notice any correlation between the line graph and the phases of the Moon?
After making your own observations, scroll down for an explanation of what you’re seeing.
.
.
.
.
.
.
The Shape of the Line Graph
The high tide graph has two peaks—it begins by rising and peaking around April 8th, then falls, and rises again, peaking around April 23rd, and ending the month by falling again. So there are two local maximums. In statistics, these are called the modes.
The low tide graph has a similar shape, but flipped upside down. It begins be falling, with the lowest point around April 8th, then it rises and falls, before starting to rise again around April 23rd. So there are two local minimums, which correspond to the local maximums on the high tide graph.
Relationship to Moon Phases
April’s full moon falls on April 8th and it’s new moon on April 23rd. It’s not a coincidence that the highest high tides and lowest low tides occur on these dates. The full and new moon happen when the Earth, Moon, and Sun are aligned. Since both the Sun and Moon’s gravitational pull act on the Earth, when these bodies are aligned, the stretch the tidal bulge, either in both directions, for the full moon, or strongly in one direction, for the new moon.
Conversely, the lowest high tides and highest low tides occur during the first and last quarter moons. This also has to do with the placement of the Moon and the Sun. During a quarter moon, the Moon and Sun are at a 90° angle to each other. Both the Moon and Sun’s gravity are pulling the ocean waters, so the high tide caused by the Moon is lower, since the low tidal waters are being pulled by the Sun.
So the answer to our original question is: yes, there is a relationship between the phases of the Moon and the tides.
Extra activity: Moon Phases and Tides Coloring Flip-book
Materials:
Colored pencils
Scissors
Small binder clip
Flip-book coloring pages, printed out on sturdy paper
Colored paper (optional)
Instructions:
Color in the pages—you can either start with a new moon or a full moon, the design allows for either order.
Cut out the pages, making sure to keep them in the order they were printed. If you would like. You can also cut out a piece of colored paper as a cover page. Clip all the pages together.
Done—watch the tides rise and fall as the Moon changes phases!